How to build and use a PantoGraph#
The PantoGraph is an earlier version of the plotter that uses a slightly different design. The PantoGraph is more complex to build, and its geometry imposes some limitations on its range of movement.
It’s important to understand that while the BrachioGraph arms can move safely through most of their travel, for the PantoGraph there are many more combinations of angles that put them into impossible positions, which makes setting it up more challenging.
Build the plotter#
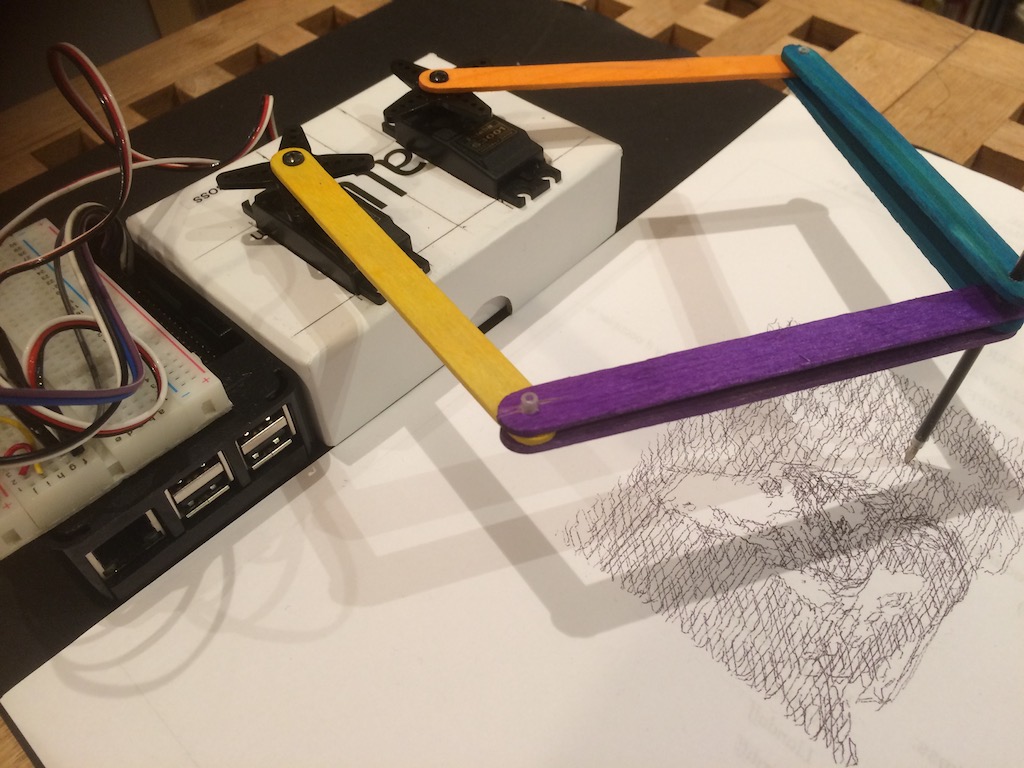
Use the photographs as a guide.
The two arm-driving servos should be as close together as possible for the best results, but not so close that they foul each other (ideally, their motors should be on the same axis, but this would require mounting one upside-down above the other).
The arms should be as low as possible. The higher they are, the harder it will be to make the pen tip accurately track the movement of the pantograph.
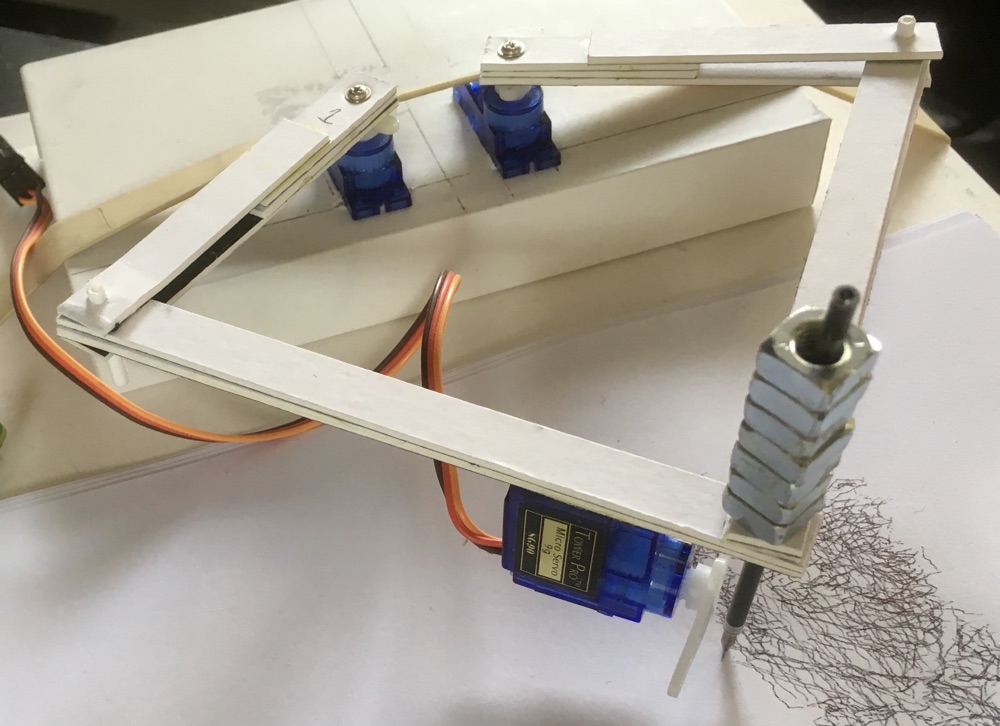
You need two pairs of arms:
two driver arms, attached to the servos
two follower arms, attached to the pen
Make the driver arms about half the length of the other two. This gives the servos more mechanical advantage, and makes the plotter more accurate.
Using servos such as SG90s, it’s recommended to make the length between holes no more than 5cm (drivers) and 10cm (followers).
The arms can have a tendency to twist. Double or even triple arms to hold the pen will help keep it straight.
Cut sections of ball-point tube to use as hinges; you can also use pins.
Fasten the arms loosely to the servos - don’t tighten them yet.
Make sure your pantograph moves freely.
Basic geometry#
Imagine a straight line through the centre of the spindles of the two motors. This is your pantographs’s X-axis. The point in the middle between the two spindles is 0. The left-hand motor position is the distance from 0 (a negative number) and the right-hand motor position is the distance in the other direction - for example, -2.5 and 2.5.
These are your values for MOTOR_1_POS and MOTOR_2_POS respectively.
This line also represents 0 on the Y-axis.
We need two more values:
DRIVER, the length between the holes in the driver armsFOLLOWER, the length between the holes in the follower arms
We’ll use these values shortly.
Wire up up the servos#
Wire the servos to a Raspberry Pi.
The plotter defaults to using the following GPIO pins for the arms:
14: left arm
15: right arm
18: pen up/down
Test it#
In a Python 3 shell, create a PantoGraph instance, using the values you noted earlier:
from pantograph import *
pg = PantoGraph(driver, follower, motor_1_pos, motor_2_pos)
The servos and arms will move immediately (this is why it’s important to have fastened the arms loosely). Now issue a command:
pg.set_angles(0, 0)
This sets both arms to 0 degrees, i.e. straight ahead out over the paper. Adjust the arms and tighten them. Continue, each time checking that the behaviour of the machine seems correct:
pg.set_angles(-15, 0)  # set arm 1 to -15 degrees, arm 2 to 0 degrees
pg.set_angles(0, 0)
pg.set_angles(0, 15)   # set arm 1 to 0 degrees, arm 2 to 15 degrees
pg.set_angles(-15, 15)
As you gain confidence, try larger angles:
pg.set_angles(-30, 30)
pg.set_angles(-45, -45)
pg.set_angles(-60, -30)
pg.set_angles(-60, 15)
pg.set_angles(-60, 0)
pg.set_angles(-60, -15)
pg.set_angles(-60, -30)
… and so on.
Important
Generally, you should avoid angles greater than 90 degrees between the two arms.
Now try a test pattern:
pg.test_pattern(repeat=5)
Or commanding the arm to move to particular x/y positions:
pg.xy(x, y)
And drawing a line to a new point:
pg.draw(x, y)
Draw images#
The Pantograph class works much like the BrachioGraph class, and includes similar methods for drawing, including
plot_file().
Calibrate the PantoGraph more accurately#
Like the BrachioGraph, the PantoGraph uses hobby servos, not precision devices, not to mention a mechanism made of card and ballpoint pens. There is enough slack and play in this system to swamp any delicate adjustments you make completely.
Still - we should do the best we can. So:
Remove the arms from the servos. Start up a PantoGraph:
from pg import *
pg = PantoGraph()
Start with motor 1; run:
pg.set_pulse_widths(pin=14, pw=1500)
1500 µs is the nominal pulse width corresponding to the nominal central or neutral position of most servo motors.
Now attach attach a long horn to the servo, so that you can more easily judge its angles. If 0 degrees is straight ahead, pointing out over the paper, attach the horn at whatever seems closest to -30 degrees, i.e. pointing outwards. (We want it pointing outwards in the centre of its range of movement, as most of the time in practice the arm will need to point outwards.)
Now, change the pulse width, until the horn points straight ahead at 0 degrees. This is your centre value; make a note of it.
Do the same for -90 degrees (straight out).
Now you know what value corresponds to 0 degrees for that arm, what value corresponds to 90 degrees, and if you divide the difference between them by 90 you’ll know what change in pulse width corresponds to a 1 degree change:
(*centre value* - *straight out value*) / 90
This is the multiplier value for that arm.
Now repeat the process for the second arm.
It helps a lot to judge the angles if you actually attach an arm to the horn, once you’re confident that you’re not going to be making them smash into each other.
Suppose your values were as follows:
Servo 1 0 degrees: 1060
Servo 1 -90 degrees: 2020
Servo 2 0 degrees: 1775
Servo 1 90 degrees: 860
Then you would instantiate your PantoGraph object thus:
pg=PantoGraph(
    centre_1=1060,
    multiplier_1=(2020-1060)/90,
    centre_2=1775,
    multiplier_2=(1775-860)/90
)
And now you’ll find that when you issue a command such as:
pg.set_angles(-45, 45)
both arms will - you hope - point out at a perfect 45 degrees.